#statusMessage#
Do you want to start the compare now?


With the increasing importance of renewable energies in the wake of climate change, solar energy is moving further into ...

The complexity of military radios and the often harsh weather conditions have a negative impact on the reliability of ra...
Automation with thermal imaging technology has proven to be a reliable solution for quality control in various industrie...

In diesem exklusiven Whitepaper erfahren Sie, wie Sie mit der richtigen Messtechnik arbeiten: ✔ Sie realisieren ein Test...
The spectrum analyzer is an indispensable piece of measuring equipment in development, production or quality assurance. It offers the dynamic range required to precisely display the frequency components of an RF signal. Specialized software packages optimize the spectrum analyzer, for example for EMC diagnostics, noise factor measurement, power testing of RF transmitters or the measurement of interference emission in wireless communication. Integrated signal standards and demodulation functions enable new developments to be tested quickly and cost-effectively. What does dataTec contribute to this?
The Spectrum analyzer or signal analyzer records the signals in a frequency range and displays them in a frequency spectrum (spectrum for short). The frequency spectrum is displayed within a diagram. The frequency is usually shown on the X-axis (horizontal axis) and the amplitude on the Y-axis (vertical axis) – usually on a logarithmic scale either as voltage or as power (dBm). In contrast to the related oscilloscope measuring device, spectrum analyzers therefore display the signal curve over the frequency and not over time.

Our normal day-to-day interaction is in time and all events have a time reference - we also view the electrical signal curves with an oscilloscope in the time plane. So why spectrum analysis? What is a spectrum?
Ever since Jean Baptiste Joseph Fourier (1768-1830), we have known about the "parallelism" of the time and frequency planes. A periodic time signal can be simulated by a sum of its harmonics in the frequency range. For example, a square-wave pulse sequence can be composed of a sum of an infinite number of sine functions with odd multiples of the fundamental frequency and the corresponding odd part of the fundamental wave amplitude.

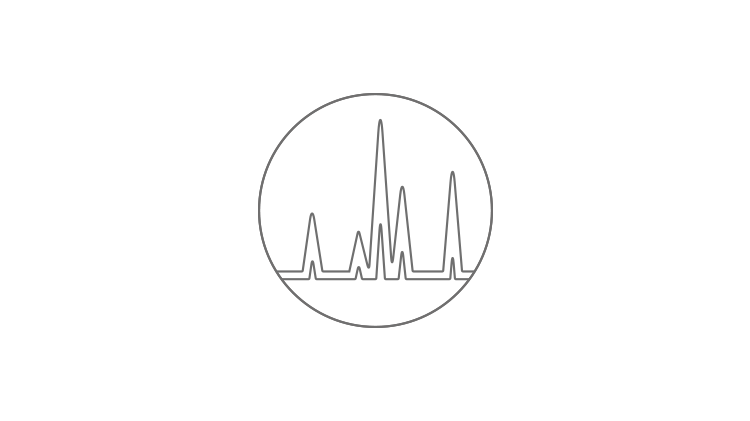
By definition, a spectrum is a collection of sinusoidal curves of different amplitudes (and different phases) which, when summed, result in a periodic complex function. The figure shows this relationship: in the time domain, a relatively complex function is visible which, as shown in the frequency plane, is composed of three sinusoidal curves. The image displayed by a spectrum analyzer corresponds to the right-hand image segment.
How does spectrum analysis help in everyday measurement technology? One example: if you want to check the quality of a square wave signal, spectrum analysis can be used very well by displaying both the frequencies and the corresponding amplitudes of the sine waves involved on the spectrum analyzer. It is very easy to determine from this whether the respective oscillations and amplitude values are or may be involved at all according to theory. A spectrum analyzer can be used to obtain information about these sinusoidal functions and their respective:
However, a spectrum analyzer cannot be used to determine the phase position of the individual sinusoidal signals in relation to each other. Vector signal analyzers or network analyzers are required if the phase relationship between the sinusoidal signals also needs to be measured. This means that a complete description of a periodic signal in the time domain requires a whole set of parameters consisting of frequencies, the associated amplitudes and the respective phases in relation to the basic signal.
Commercially available spectrum analyzers cover a frequency range from 3 Hz to 50 GHz.
Depending on the intended use, this frequency range may be limited and may be sufficient for EMC (electromagnetic compatibility) applications from 100 kHz to 8.5 GHz, for example.
Theoretically, when transforming from the time domain to the frequency domain, the temporal signal must be considered over an infinite period of time. For practical reasons, however, only a certain period of time is considered in order to carry out measurements.
This is the difference between the Fourier transformation, which covers the infinite time or frequency range, and the Fast Fourier Transformation (FFT), which for practical reasons only considers a limited time or frequency range.
Now the question might arise: why do we still need measurements in the time domain at all?
Some measurements can only be performed in the time domain, e.g. measurement of rise and fall time, eye diagram measurements, etc. With regard to spectrum analysis, the counter question is: why measurements in the frequency range? - much more interesting.
For example, the magnitude of the transmission function (attenuation curve) of a filter as a function of frequency can be measured very well. Engineers, e.g. from the telecommunications sector, are very interested in the level of interference within the transmission band under investigation and the level of interference radiating into neighboring transmission bands. For mobile radio networks, for example, the transmission channels must be examined to ensure that harmonics of the carrier signal do not interfere with other transmission systems.
All electronic devices must be checked for compliance with the applicable standards (VDE / EN) to determine whether they emit electromagnetic radiation into the environment and how high these values are at different frequencies and in the frequency ranges. A suitable measuring device for such tests is a spectrum analyzer. It can be used to determine at which frequency the radiation occurs, how high the power level of this frequency is and whether a permissible limit value is exceeded.
These measurements are very time-consuming, as the measuring antenna must be guided completely (360°) around the device under test in 15° steps. It is then necessary to install the antenna at a different height and repeat these 24 measurement steps. Since each measurement requires a very low frequency resolution and the spectrum analyzer has to be swept over the entire frequency range, this takes an enormous amount of time.
This measurement time can be significantly reduced by recording in the time domain and applying the FFT (Fast Fourier Transformation) to this data set. Applying this trick allows you to examine only those signals in the frequency range whose signal peak comes too close to a tolerance mask or even exceeds it. The advantage is a considerably faster measurement. Multiple development loops can thus be avoided. The amortization and profitability of the spectrum analyzer is therefore beyond doubt.
As mentioned above, spectrum analyzers are designed for specific applications (telecommunications, wireless connections such as Bluetooth, etc.). For example, they contain the corresponding limit value masks for EMC measurements as required by legal regulations. The user can see directly whether a possible signal is within the tolerance limit or whether it has already been reached or even exceeded. Furthermore, devices are available for mobile communication that display the tolerance masks for a specific transmission channel.
Benchtop spectrum and signal analyzers are well suited for research and development or design verification. They are used for interactive analysis and troubleshooting. Bench-top analyzers are available in a wide price/performance range so that users can choose devices that meet their requirements.
Handheld devices are rugged, accurate, fast and easy-to-use portable spectrum analyzers, made for the challenges faced by field technicians and engineers. Handheld analyzers are optimized for long battery life and minimal weight.
You are not quite sure yet or have further questions about the products? Do not hesitate to contact us. Whether directly on the phone or via online demo conveniently in front of your screen - our experts are there for you.
