#statusMessage#
Do you want to start the comparison now?


How Thermography Enhances Manufacturing. Machine stoppages, component overheating, or electrical faults—unplanned downti...

Disturbances in the power grid often go unnoticed until systems shut down or equipment fails. Regular power quality asse...

In this practical checklist you will learn how to calibrate your measuring and test instruments effectively – simply, ef...
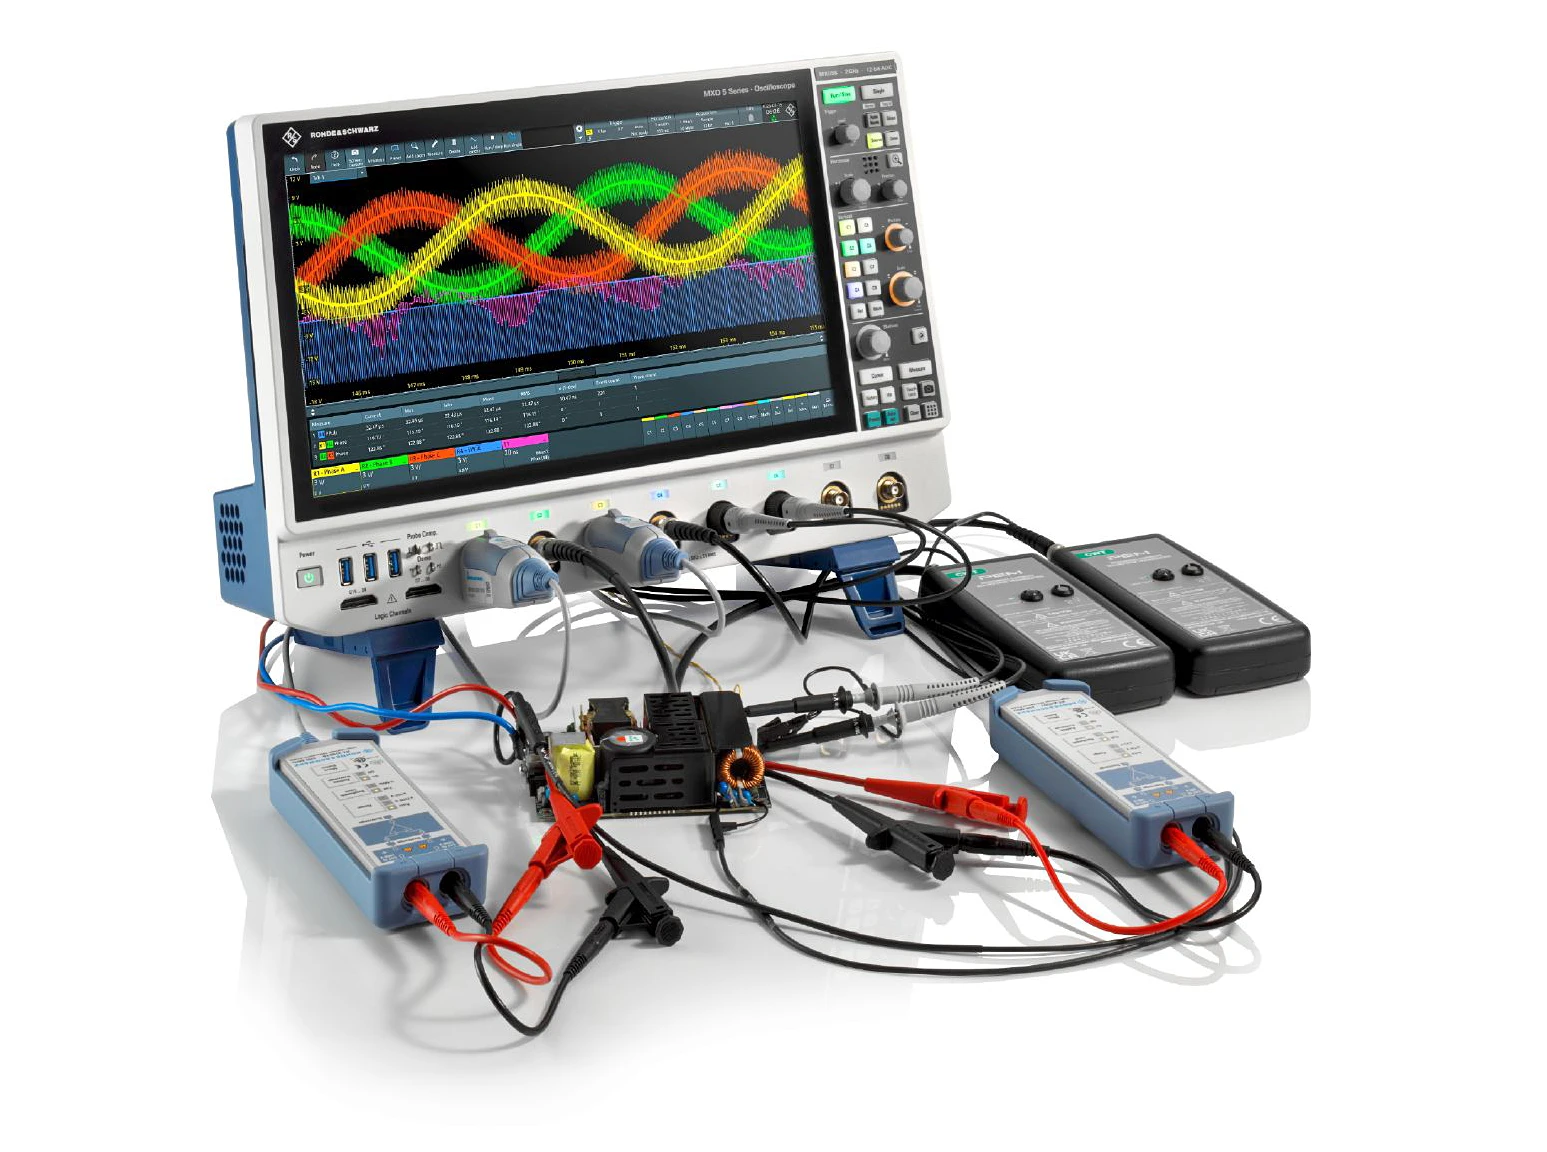
Modern oscilloscopes of the MXO Series from Rohde & Schwarz enable precise analysis and optimization of electric dri...

Network analysis is used, for example, in stability tests, to characterize components or to measure the frequency response. Typical applications with the vector network analyzer (VNA) are, for example, measuring the insertion loss of filters or the transmission characteristics of amplifiers. This article provides an overview of the basic principles of network analysis, including relevant RF basics on the subject of transmission lines or Smith charts.
A vector network analyzer (VNA) measures the reflected and transmitted portions of a signal that is coupled into a transmission line, reflected back to the source on the transmission line (due to an impedance mismatch) and effectively transmitted to the receiver component, such as an antenna.
Network analyzers use an integrated signal generator to send a signal with a known frequency, amplitude and phase to a device under test. The excitation of the circuit is measured to obtain the "scattering parameters" (S parameters). The device under test reflects part of this signal. The remaining signal components reach the DUT, where they are modified (attenuated, amplified, phase-shifted, mixed) and emerge at the DUT output as a transmitted signal. Due to mismatching to the load, part of the transmitted signal can be reflected here too.
Efficient power transmission is a fundamental requirement for communication systems. In order to transmit or receive RF signals without interference, the impedances of the transmission lines, antennas, amplifiers etc. must be correctly matched to the signal source. Impedance mismatches occur when the real and imaginary components of the input and output impedances between two connected devices are not ideal.
Signal distortions in a communication system can be caused by non-linear effects, for example when intermodulation products are generated from desired carrier signals. However, linear systems can also cause signal distortion by influencing the amplitude or phase relationships within the frequency spectrum of a signal.
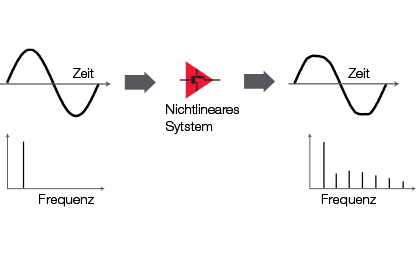
Both active and passive non-linear devices can shift the frequency of an input signal or add other frequency components, e.g. harmonics and interference signals.
Example of non-linear induced distortion: If an amplifier is driven on the input side, the output signal overdrives because the amplifier is saturated. The output signal is no longer a pure sine wave. Harmonics occur which are a multiple of the input frequency. Passive systems can also exhibit non-linear behavior at high power levels, e.g. an LC filter that uses inductors with a magnetic core. Magnetic materials often exhibit hysteresis effects that are non-linear.
Fig.: Non-linear induced distortion (in German)
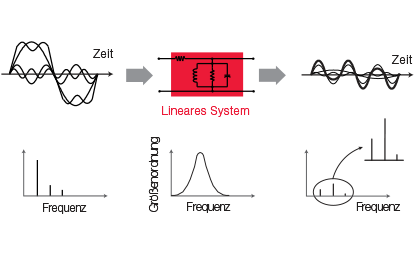
With linear devices, the input signals are changed in magnitude (amplitude) or phase. The input and output frequencies are identical; no additional frequencies or new signals are generated. For linear, distortion-free signal transmission, the amplitude response of the device under test (DUT) must be flat and the phase response linear over the desired bandwidth.
Example of linear induced distortion: A square-wave signal with high-frequency components passes through a linear bandpass filter, which allows selected frequencies to pass with low attenuation. Even if the filter has a linear phase power, the components outside the frequency band are attenuated, leaving an output signal that is more sinusoidal. If the same square-wave input signal is passed through a linear filter that only inverts the phase of the third harmonic but leaves the amplitudes unchanged, the output signal is more impulse-shaped.
Fig.: Change in amplitude with frequency (in German)
In order to fully characterize a linear network and ensure distortion-free signal transmission, the amplitude and phase response must be determined and complex impedance measurements performed. Development engineers for computer-aided engineering (CAE) circuit simulation models also require precise amplitude and phase values for the components used in the circuits. For a characterization in the time domain, the inverse Fourier transformation is also required. This is based on the amplitude and phase response.
The measurement accuracy can be improved using "vector error correction" by eliminating the effects of inherent measurement system errors. An effective error model requires precise amplitude and phase information.
The Smith chart is a typical representation of the measurement results. It can be used to determine the stability or vibration resistance of a circuit. The system behavior near the oscillation limit (pole positions) provides relevant information for the system design. It must not start to oscillate on its own due to an excitation (e.g. a disturbance pulse), which would correspond to a system failure.
The reflection of a signal depends on the impedance that "sees" the incident signal. Each impedance can be represented by a real and an imaginary component (R + jX) and mapped in the form of a rectilinear grid. An open circuit appears on the axis at infinity and therefore cannot be displayed.
Fig.: Linear impedance plane and impedance plane as a polar diagram
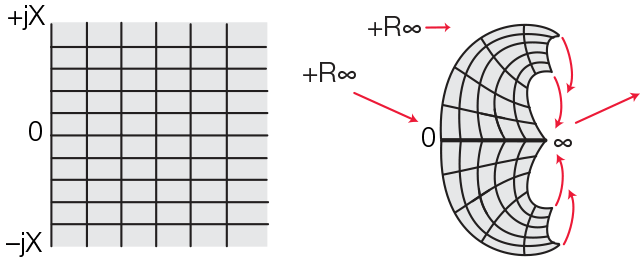
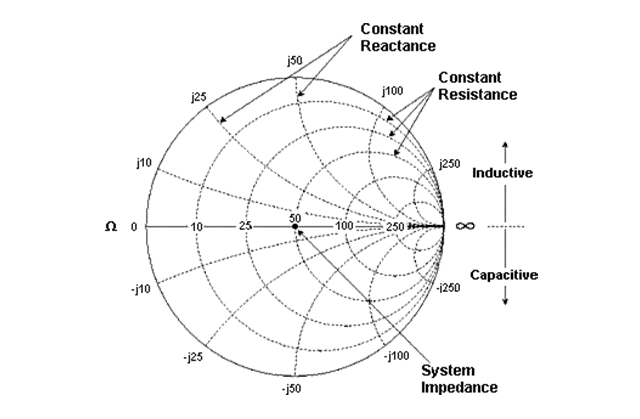
The positive half of the impedance plane represents the "Smith chart". On the Smith chart, a constant resistance appears as a circle; reactances appear as arcs. The impedances in the Smith chart are always standardized to the characteristic impedance of the component or system in question, usually 50 ohms for HF systems. The center of the diagram represents the ideal signal connection.
Fig.: Example of a Smith chart and its interpretation
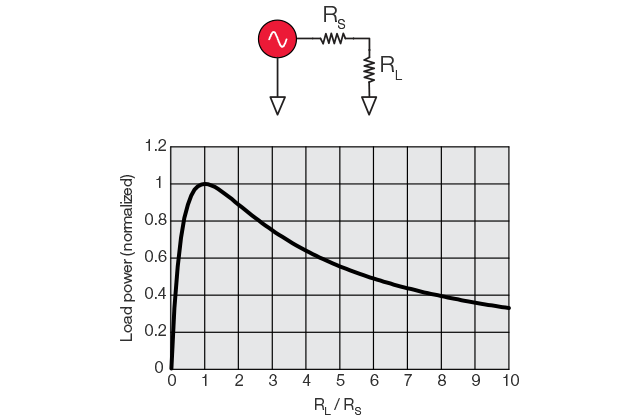
The connection between two devices must be perfectly matched so that maximum signal power can be transmitted to a load. This means that the output impedance RS of a source and the input impedance RL of a load must be optimally balanced. This condition is fulfilled if RL = RS, regardless of whether the stimulus originates from a DC voltage source or from RF sine waves. If the source impedance is not a pure ohmic resistance, the maximum power transmission occurs when the load impedance is equal to the conjugate complex impedance of the source. (Example: If RS = 0.6 + j 0.3, then the complex conjugation is RS* = 0.6 - j 0.3).
Fig.: Optimum signal transmission occurs when RL = RS.
Signal transmission through a transmission medium can be compared to traveling waves. At very low frequencies, i.e. at longer wavelengths, a simple wire is sufficient. Its resistance is relatively low and the effect on low-frequency signals can be neglected. Higher frequencies require a high-quality transmission line with a suitable terminating resistor. The terminating resistor absorbs the incoming signals and prevents unwanted reflection. If the line is terminated with a resistor that corresponds to the wave impedance, optimum signal transmission is achieved. If the terminating resistor does not correspond to the characteristic impedance, signal components are reflected back to the source.
In the event of a short circuit, i.e. no voltage is maintained, a reflected wave runs along the line back to the source. The reflected and incident voltage waves each have the same magnitude, but move in opposite directions. If the transmission line forms an open circuit, the reflected current wave is 180 degrees out of phase with the incident wave, while the reflected voltage wave is in phase with the incident voltage wave at the level of the load. This guarantees that the current at the open point is zero. The reflected and incident current waves each have the same amplitude, but run in opposite directions.
In both cases, short circuit and open circuit, a standing wave pattern is formed on the transmission line. The voltage troughs are zero and the voltage peaks are twice as high as the incident voltage.
The termination of a 50 ohm transmission line with a 25 ohm resistor leads to a state between complete absorption and complete reflection, i.e. part of the incident power is absorbed and part is reflected. The amplitude of the reflected voltage wave is one third of the amplitude of the incident wave. Both shafts are 180 degrees out of phase at the height of the load. The valleys of the standing wave pattern are no longer zero, and the peaks are smaller than in the case of a short circuit or open circuit. The ratio between the peaks and the valleys is 2:1.
Modern vector network analyzers measure the incident and reflected waves directly during a frequency sweep. The impedance results can be displayed in various formats including the VSWR (voltage standing wave ratio).
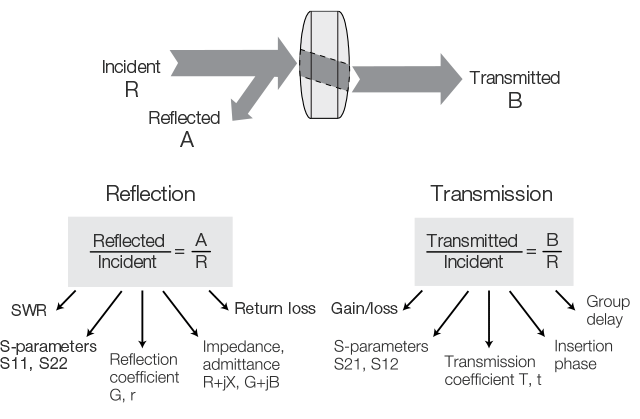
Network analysis generally refers to the measurement of an incident wave with the R or reference channel. The reflected wave is measured with the A channel and the transmitted wave with the B-channel. The amplitude and phase information of these waves can be used to quantify the reflection and transmission properties of a device under test. Reflection and transmission can be represented as vectorial (magnitude and phase), scalar (only magnitude) or only phase-related quantities. For example, return loss is a scalar measurement of the reflection, while impedance is a vectorial reflection measurement.
To fully characterize an unknown linear system with two terminations, we need to perform measurements under different conditions and calculate a number of parameters. These parameters can fully describe the electrical behavior of our system, i.e. our network, even under varying source and load conditions.
Fig.: Terminology in the characterization of high-frequency devices using the vector network analyzer
The characterization of low-frequency devices or networks is usually based on the measurement of the H, Y and Z parameters. For this purpose, the total voltage and the total current must be measured at the inputs or outputs of the device or at the nodes of the network, even under open-circuit and short-circuit conditions.
At higher frequencies, it is difficult to determine the total voltage/current, so the S parameters are preferred here. These refer to known measurements such as amplification, attenuation and reflection coefficient, which are possible without connecting unwanted loads to the measurement object. The S parameters of several components can be cascaded to predict the performance of an overall system. S parameters can be used in both linear and non-linear CAE circuit simulation tools. H, Y and Z parameters can be derived from S parameters if required.
The number of S parameters for a particular device under test is equal to the square of the number of its connections. For example, a device with two connections has four S parameters: S11, S12, S21 and S22. According to the nomenclature of the S parameters, the first number describes the connection at which the energy exits. The second digit indicates the connection at which the energy enters.
Example: The S parameter S21 describes the energy that emerges at connection 2 when an RF stimulus is applied to connection 1. If the numbers are the same (e.g. S11), this is a reflection measurement.
Fig.: S parameters of a device under test with two connections
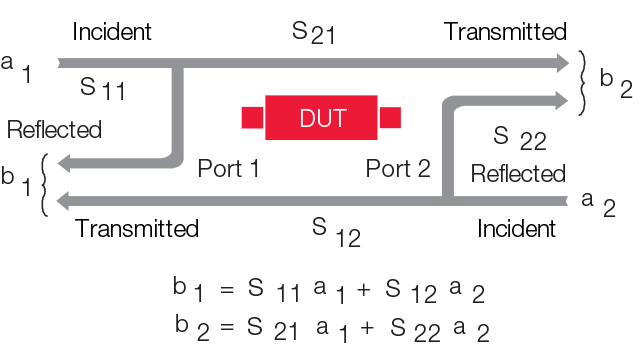
The scattering parameters provide information about which signal components are transmitted and how high the reflected components are. They are parameters that describe the linear behavior of a device under test. S parameters can be used for further simulations.
S parameter S11: The input reflection factor provides information about the matching of the signal source to the circuit.
S parameter S22: The output reflection factor provides information about the matching of the output to the input of a subsequent circuit.
S parameter S21: The transmission factor is synonymous with the amplification or attenuation of the signal by the circuit to be measured.
S parameter S12: The reverse transformation factor provides information about the signal component that is reflected from the output of the circuit under test to its input.
Using ratio measurements, we can perform reflection and transmission measurements that are independent of both the absolute power and the changes in source power versus frequency. The relative reflection (= reflection coefficient) is often shown as A/R and the relative transmission as B/R, which refers to the measurement channels. The reflection coefficient is the amplitude ratio between the reflected and incident signal voltage.
The return loss (RL) is a method of representing the reflection coefficient in logarithmic form (in dB). The return loss is the number of decibels by which the reflected signal is less than the incident signal. The return loss is always expressed as a positive number and varies between infinity for a load with wave impedance and 0 dB for a short circuit or open circuit.
The return loss is directly related to the voltage standing wave ratio (VSWR). VSWR is defined as the ratio of the maximum voltage to the minimum voltage in a standing wave pattern. The VSWR value ranges from 1 (no reflection) to infinity (complete reflection).
The transmission coefficient is defined as the transmitted voltage divided by the incident voltage. If the absolute value of the transmitted voltage is greater than the absolute value of the incident voltage, this is referred to as amplification of the device under test or system. If the transmitted voltage is lower than the incident voltage, this is referred to as attenuation or insertion loss.
Stationary network analyzers (benchtop or desktop analyzers) are generally very powerful, universally applicable devices. They offer high measurement accuracy and measuring speed as well as a wide frequency range. High-quality desktop analyzers also impress with their high dynamic range and output power and low noise values. They are ideal for the development and production of RF components and are used, for example, in the communications and electronics industry, for design verification of digital high-speed PCBs or for applications in the aerospace industry. These include USB network analyzers (VNA), which combine the performance and precision of high-quality desktop VNAs with the flexibility of mobile network analyzers.
About our stationary network analyzers
Handheld analyzers are particularly robust, easy to operate and specially designed for field use, e.g. in the service sector or for the installation and maintenance of antenna systems. As a rule, these are multifunctional combination devices for a wide range of measurement applications, e.g. as network analyzers, spectrum analyzers, cable and antenna analyzers or RF power meters. Due to their compact design and extensive functions, performance may have to be compromised.
You are not quite sure yet or have further questions about the products? Do not hesitate to contact us. Whether directly on the phone or via online demo conveniently in front of your screen - our experts are there for you.
.webp "Seminar LabVIEW Core 3")

