#statusMessage#
Do you want to start the compare now?
#statusMessage#
Do you want to start the compare now?

With the increasing importance of renewable energies in the wake of climate change, solar energy is moving further into ...

The complexity of military radios and the often harsh weather conditions have a negative impact on the reliability of ra...

Automation with thermal imaging technology has proven to be a reliable solution for quality control in various industrie...

In diesem exklusiven Whitepaper erfahren Sie, wie Sie mit der richtigen Messtechnik arbeiten: ✔ Sie realisieren ein Test...
Manufacturer number: MDO-2104EG
| Article number: | 01MD214EG0GT |
|---|---|
| Bandwidth (MHz): | 100 |
| Counter: | Yes |
| DVM: | No |
| Dimensions (L x W x H) (mm): | 127,3 x 384 x 208 |
| Function generator: | AWG25MHz |
| Interfaces: | USB, LAN |
| Model: | MDO-2104EG |
| Number of channels: | 4 |
| Samplerate: | 1 GSa/s |
| Screen size: | 20 cm |
| Screen type: | 800 x 480, WVGA |
| Segmentable memory: | Yes |
| Signal acquisition rate: | 120.000 wfms/s |
| Storage depth: | 10 MPts |
| Triggertypes: | Edge, Pulse Width (Glitch), Video, Pulse Runt, Rise&Fall (Slope), Alternate, Time out, Event-Delay, Time-Delay, Bus |
| Vertical resolution: | 8-bit |
| Warranty (years): | 2 |
| Weight (kg): | 3 |
The MDO-2000E series oscilloscope offers a bandwidth of 100 MHz and a real-time sampling rate of 1 GSa / s. The display and the 1 mV / div vertical resolution enable the MDO-2000E series to measure complex and weak signals and to present the clear measurement results.
The multi-domain oscilloscopes of the MDO-2000E series offer a memory depth of an unbelievable 10 Mpts as standard in order to completely retrieve and analyze the signal. Depending on the measurement application, the memory depth can be set to 1 k, 10 k, 100 k, 1 M or 10 M. A short memory depth in connection with the high sampling rate enables the user to observe a rapidly changing curve shape and on the other hand, with the selection of a large memory depth, slowly changing curves can be verified continuously.
With the standard segmented memory function , the acquisition memory is max. 29,000 segments divided in order to optimally use the memory depth of 10 Mpts available to you. It can be triggered on waveforms that are of particular interest and saved in the segmented memory (you fill a segment with each trigger event). This increases the storage effectiveness enormously.
The MDO-2000E oscilloscope series is equipped with a "waveform search function" and a segmented memory to extend the signal observation time of the flexible 10 Mpts long memory. The segmented memory can be divided into 29,000 areas in order to bypass uninteresting signal sequences and to be able to search through all essential signal sequences. This allows important signal sequences to be displayed and saved. With the "waveform search function" users can quickly search the desired curves for the trigger conditions.
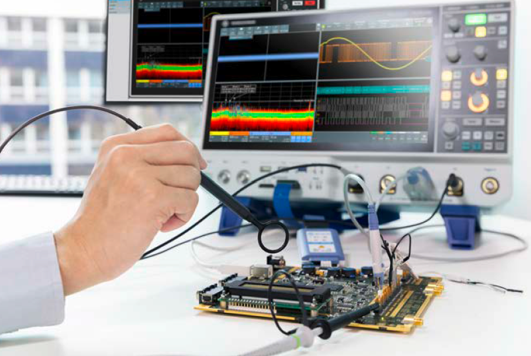
The MDO-2000E Mixed Domain Oscilloscope Series enables users to easily and fully observe the turn-on behavior and rare transient waveforms. This makes waveform debugging easier by using the advanced VPO (Visual Persistence Oscilloscope) signal processing technology , which achieves a signal update of 120,000 wfm / s and writes these respective waveforms on the screen for a multi-layer signal display and thus an improved display to reach the signals. Oscilloscopes with VPO technology display the signals in a 3-dimensional arrangement of amplitude, time and signal strength for each signal point. 256 different colors indicate signal changes. Compared to a conventional digital storage oscilloscope, the MDO-2000E series offers much more natural and real displays that correspond to the real signal.
If you use the spectrum analyzer mode, the frequency level is shown on the display. Users can enter various characteristic parameters, depending on the application requirements, such as B. Display center frequency, displayed frequency range (span), start frequency and stop frequency. This allows the required frequency range to be examined very quickly and intuitively. The user interface corresponds to a real spectrum analyzer.
Signal characteristics and components can be identified much more easily in the frequency level than in the time level. So z. B. the composition of the signal harmonics or the frequency characteristic of a modulation signal.

Navigating through the range of available specifications, options and capabilities can be challenging. There are a lot o...


